

Study with the several resources on Docsity

Earn points by helping other students or get them with a premium plan


Prepare for your exams
Study with the several resources on Docsity

Earn points to download
Earn points by helping other students or get them with a premium plan
Community
Ask the community for help and clear up your study doubts
Discover the best universities in your country according to Docsity users
Free resources
Download our free guides on studying techniques, anxiety management strategies, and thesis advice from Docsity tutors
A computer program designed to store, analyze, and compare morphometric data for sedimentary samples using Cailleux's, Kuenen's, and Zingg's indices. The program computes the indices, presents the results in various formats, and allows for statistical and graphical comparison of samples. The document also includes information on the transformation of indices and the use of modified Tricart's and Zingg's diagrams.
Typology: Study Guides, Projects, Research
1 / 8

This page cannot be seen from the preview
Don't miss anything!


ACTA GEOLOGICA HISPANICA, v. 20 (1985), n." 2, pags. 179-186.
Francesc GALLART (1) and Josep LLOPIS (2)
(2) Ajuntament de Vilanova i La Geltrú (Barcelona).
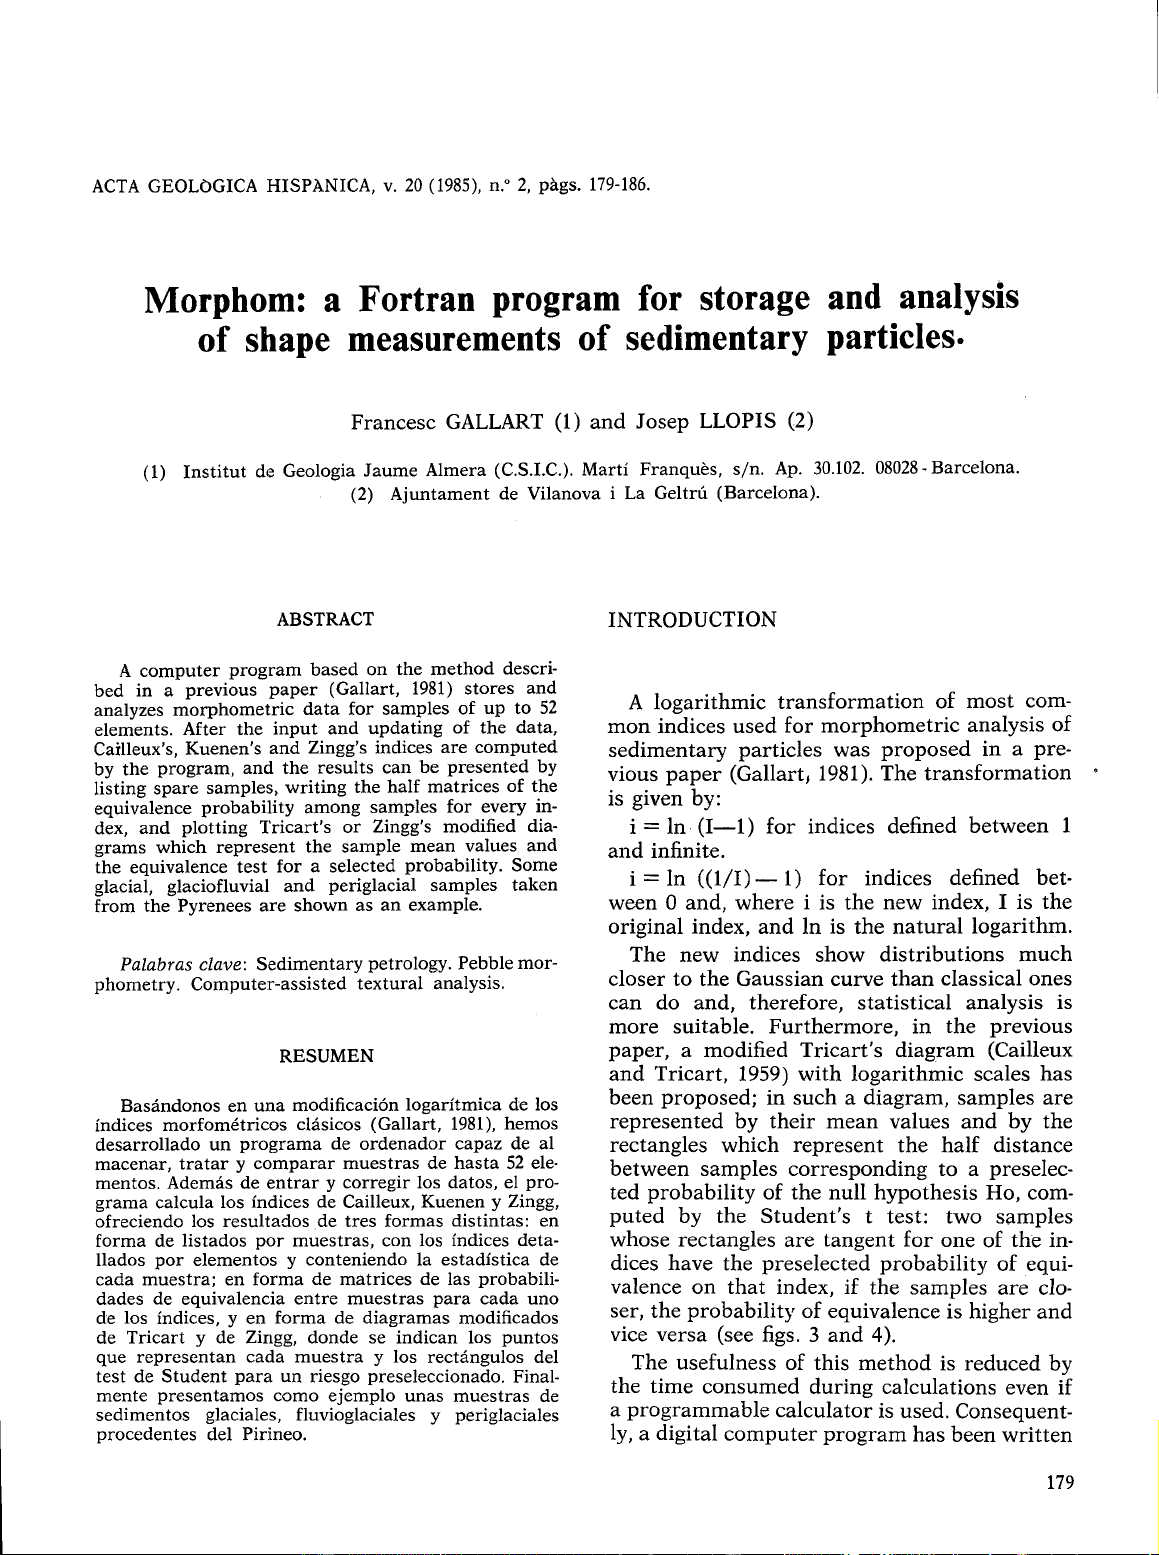
A computer program based on the method descri- bed in a previous paper (Gallart, 1981) stores and analyzes morphometric data for samples of up to 52 elements. After the input and updating of the data, Cailleux's, Kuenen's and Zingg's indices are computed by the program, and the results can be presented by listing spare samples, writing the half matrices of the equivalence probability among samples for every in- dex, and plotting Tricart's or Zingg's modified dia- grams which represent the sample mean values and the equivalence test for a selected probability. Some glacial, glaciofluvial and periglacial samples taken from the Pyrenees are shown as an example.
Palabras clave: Sedimentary petrology. Pebble mor- phometry. Compute:r-assisted textural analysis.
RESUMEN
Basandonos en una modificacion logarítmica de 10s indices morfométricos clasicos (Gallart, 1981), hemos desarrollado un programa de ordenador capaz de al macenar, tratar y comparar muestras de hasta 52 ele- mentos. Además de entrar y corregir 10s datos, el pro- grama calcula 10s índices de Cailleux, Kuenen y Zingg, ofreciendo 10s resultados de tres formas distintas: en forma de listados por muestras, con 10s índices deta- llados por elementos y conteniendo la estadística de cada muestra; en forma de matrices de las probabili- dades de equivalencia entre muestras para cada uno de 10s indices, y en forma de diagramas modificados de Tricart y de Zingg, donde se indican 10s puntos que representan cada muestra y 10s rectángulos del test de Student para un riesgo preseleccionado. Final- mente presentamos como ejemplo unas muestras de sedimentos glaciales, fluvioglaciales y periglaciales procedentes del Pirineo.
A logarithmic transformation of most com- mon indices used for morphometric analysis of sedimentary particles was proposed in a pre- vious paper (Gallart, 1981). The transformation is given by: i = ln (1-1) for indices defined between 1 and infinite. i = ln ((l/I)- 1) for indices defined bet- ween O and, where i is the new index, I is the original index, and ln is the natural logarithm. The new indices show distributions much closer to the Gaussian curve than classical ones can do and, therefore, statistical analysis is more suitable. Furthermore, in the previous paper, a modified Tricart's diagram (Cailleux and Tricart, 1959) with logarithmic scales has been proposed; in such a diagram, samples are represented by their mean values and by the rectangles which represent the half distance between samples corresponding to a preselec- ted probability of the nul1 hypothesis Ho, com- puted by the Student's t test: two samples whose rectangles are tangent for one of the in- dices have the preselected probability of equi- valence on that index, if the samples are clo- ser, the probability of equivalence is higher and vice versa (see figs. 3 and 4). The usefulness of this method is reduced by the time consumed during calculations even if a programmable calculator is used. Consequent- ly, a digital computer program has been written
1 : 50.000 TOP. MAP SHEET No: 419 U. T. M. COORD. : X= 396.8 Y= 89.6 ALTITUDE: 190 IS FROM STUDY: Estudi Geomorf. Penedes AUTHOR: Francesc Gallart FORMATION: CONT. MIOCENE REFERENCE: AGE: MlOCENE REMARKS:
NO. A B C REM. AL EL SL CMBQ 0.647 0.363 0. CRB -0. 143 0. 118 0. 118 CMBB -1. 170 0.595 -0. CMRB 0.742 -0.780 -0. CEB -0.565 -0.499 -0. CMBB -0.693 O. 172 0. CBRD 0.354 0.560 -0. CIO -0. 693 O.734 -0. 163 C 100 0.063 0.560 -0. CBBP -0. 478 -0. 693 -1. 792 CMBB -0.223 0.405 -0. CBBD -0.383 -0.693 -0. CMBQ -0. 105 0.000 -0.5 1 1 CMB 0. 118 0.882 0. CMB -0.758 -0. 113 -0. CMB 0. 148 -0.875 -1. CEG -0. 127 0.095 -0. CDBQ 0.405 0.000 0. CEG 0.383 0. 095 -1. 163 CEG -0.619 -2.079 -2. 079 CMBB 0. 189 0.460 0. CMOQ -0.856 -0.598 -1. CEC -0.288 -0.405 -0. CBOM -0.894 0. 172 -0. CEG -1. 190 0.061 0. 061 CBB -0.274 O. 595 O.
NO. A B C
FIRST REFERENCE: IAO
REM. AL EL SL CRB -0.204 0.095 -0.
CIOB 0.154 0.272 -0. 163 CMOQ -0.274 0. 916 0. CEB -0.095 0.754 0. CMGG -0.727 0.300 -0. CMBB -0.223 1. 386 0. CMBQ -0.405 -0.827 -1. 281 CIGQ O. 198 -2.833 -3. CMBQ -0.383 0.981 -0. 182 CBRD -0.395 -1. 792 -1. 792 CIB O. O00 -2.234 -2. CE0 0.255 -0.816 -1. 081 CIR 0.424 0. 838 0. CEGA 0. 041 0.069 -0. CMOP -0. 123 1 .012 -0. CMBD 0. 145 -0. 105 -0. CMOB -1. 056 -0.357 -1. 540 CMB -0. 182 -0.134 -1. CMBB 0.916 0.754 -0. 575 CMBB 0.091 -0.043 -0. CBBI -0.463 0.501 -0. CBOM 0. 236 0.025 -0. CBOM -0.442 -1.253 -2. CEG -0.216 0.693 0.
Figure 1. - Listing of a 51-element specimen. The 5 first lines give the heading information (identification, loca- tion and other references) which constitute the non-processable information stored in the METRIA. DAT file A, B, C, RI, R2 and REM are the measurement products forming the processable information, stored in the MOR- PHOM. DAT file; A, B and C are the three ellipsoid axes, R1 and R2 are the minimum radii, and REM are the remarks on lithological details of the elements (C represents limestones). Al are the transformed Cailleux's flat- ness indices. EL are the transformed Cailleux's roundness indices and SL are the modified roundness indices with the second minimum radii. The last three lines give the statistical results for the whole sample; M = means, S = standard deviations, N = number of elements, and Z are the different sums. AC, EC and SC are the Cai- lleux's indices corresponding to the means computed with the transformed ones, and are presented to make any comparison easier with results obtained with classical indices. On account of the skewness of the classical indi- ces, comparisons must be made with their medians, as recommended by Cailleux and Tricart (1959). Such a listing can also be obtained for Kuenen's and Zingg's indices. New calculations of other indices computed from the same measures of the elements need some modifications in the program.
Figura 1. - Listado de una muestra de 51 elementos. Las cinco primeras lineas contienen la información de la ca- becera (identificación, localización, y otras referencias); esta información es improcesable y esta contenida en el fichero METRIA. DAT. Los valores A, B, C, RI, R2 y REM son 10s resultados de las mediciones, que constituyen la información procesable, contenida en el fichero MORPHOM. DAT: A, B y C son 10s tres ejes del elipsoide; R1 y R2 son 10s dos radios minimos del plano AB; y REM son indicaciones sobre el matiz litológico de cada elemento, entendiendo que las muestras son de litologia homogénea (en este caso, C indica calizas). AL es el indice de apla- namiento de Cailleux modificado, EL es el indice de des gaste de Cailleux modificado, y SL es el indice de desgas- te modificado, tomando el segundo radio minimo. Las tres ultimas lineas contienen 10s resultados estadisticos de toda la muestra: M son las medias, S son las desviaciones tipicas, N es el numero de elementos de la muestra, y Z son 10s distintos suamtorios. AC, EC y SC son 10s indices de Cailleux que corresponden a las medias de 10s indices modificados, y que son mostrados para facilitar la comparación con datos procedentes de trabajos con 10s indices clásicos. Las comparaciones deben realizarse con las medianas de 10s indices clásicos, ya que su asimetria causa una notable desviación de las medias (véase Cailleux y Tricart, 1959). Este tipo de listado pue- de obtenerse directamente también para 10s indices de Kuenen y de Zingg. El calculo de otros indices basados en las mismas medidas de 10s elementos requeriria algunas modificaciones del programa.
to store the data, to compute Cailleux's, Kue- nen's (Kuenen, 1956) and Zingg's (Zingg, 1935) modified indices with their means and standard deviations, and to compare samples of up to 52 elements by calculating thee quivalence proba- bilities and by plotting the modified Tricart's and Zingg's diagrams. The storage of the origi- nal measurements enables calculation of any other index requiring three axes and two mi- nimum radii, and also comparison with any other sample, without re-entering the measures. Each 52-element sample needs roughly one hour for the hand measurements, using a caliper, fif- teen minutes for entering the data, and a few minutes more to list, compare and plot the re- sults by using the program. The program has been designed in a minicom- puter Digital VAX-730, using the high level pro- gramming language FORTRAN-77, and with the Opefiting System VMS. The implied periphe- rals are an alphanumeric terminal VT-100 (D. E.C.), and a line printer PRINTRONIX. In ad- dition to our own software, the functions GAU- CDF and TCDF taken from Prince (1982) are needed, and the lineprinter is used in the plot- ting mode with the help of the graphic package VPLOT, from the Digital Electronic Corpora- tion Users Society. Some modifications are needed to use the program with another termi- nal or a vectorial plotter. In the present paper the structure and utili- sation of the program are explained, with some examples of glacial and glaciofluvial samples taken from the Catalan Pyrenees.
The program has four main functions which are selected when the program starts or after finishing one of them: input and updating óf data, error correction, sample listing, and sta- tistical and graphical comparison of samples.
Morphometric data are organized in samples which include up to 52 sedimentary particles of uniform petrography, usually sized between 4 and 15 cm on the maximum axis. First the terminal asks for the number of elements in the sample and then the new sam-
ple is codified by the program: it shows the code-number and asks interactively for the hea- der data of the sample, as follows:
Figures in brackets show the maximum num- ber of characters to be used. These data are stored in the file of unproces- sable information (METRIA. DAT file) which is organized as a direct-access file with fixed- length records (154). Such an organization has been selected in ofder to minimize the time consumed during the transfer of the data bet- ween the memory and the disk; a single READ sentence is enough to transfer the whole sample from the disk to the memory, and it is not ne- cessary to search for the sample because it is directly found by its code-number. Any modifi- cation can be made by ovenvriting the modified record. This file is handled by METRIA, a subroutine of the MORPHOM program, in order to sim- plify the latter. Any change of the data stored in the METRIA. DAT file is to be made by the MORPHOM-METRIA program, but its record length allows editing by the EDIT utility of the VMS system. If EDIT is used, after editing it is necessary to modify the file organisation from sequential to direct access. After the header information, the program asks for the measures of each element of the sample: the three ellipsoid axes (a, b, c ) , the two minimum radii measured in the main plane a-b (ri and 1-2)) and four characters which re- present the details of the lithological descrip- tion of each element, which is roughly uniform for the whole sample. The monitor shows the the items to be answered: No. A B C R1 R2 REM. and the characters entered are placed by the program in their right places, except the ordi-
Figure 3. - Modified Tricart's diagram for the same specimens of the previous figure, drawn for a probability of equivalence of 0.05: two samples whose rectangles are tangent on one of the indices have this probability of equivalence (see introduction). The sample 44 is periglacial; samples 47, 48, 15, 36 and 33 are of glaciofluvial ori- gin; and the rest are glacial. The first three named samples are from Tirvia, in the Vall Ferrera valley, and the fourth is from the complex of Puigcerda, in the Cerdanya depression. The arrangement of the samples follows the model proposed by Tricart and Cailleux (1962) for limestone elements, but modified because of the flat tendency of the schists.
Figura 3. - Diagramas de Tricart modificados para las mismas muestras de la figura anterior, dibujado para una probabilidad de equivalencia de 0,05: dos muestras cuyos rectangulos son tangentes en uno de 10s indices tienen esta probabilidad de equivalencia en este indice; las muestras cuyos rectangulos se cortan se consideran equivalentes, mientras que aquellas que quedan separadas se consideran distintas. La muestra 44 es periglacial; las muestras 47, 48, 15, 36 y 33 son fluvioglaciales; y las restantes son glaciales. Las tres primeras muestras enu- meradas proceden de Tirvia, en un valle afluente de la Noguera Pallaresa, y las restantes son del complejo de Puigcerda, en la depresión de la Cerdanya. La disposición de las muestras es similar a la propuesta por Tricart y Cailleux (1962) para elementos calizos, pero algo desplazada a causa de la tendencia de 10s esquistos a dar formas aplanadas.
Figure 4. - Modified Zingg's diagram for the same samples as in the two previous figures, drawn for a probabi- lity of 0.1 of the nulll hypothesis. Some of the clusters are conserved, but a special form of the elements of the sample 48 is observed. The periglacial sample (44) is neatly discoidal, while glaciofluvial ones are more blade- like, and glacial ones more spheroidal. Zingg's classification, represented by the axes, seems to be too conven- tional for the forms studied here. Note also that dispersion of the Zingg's indices is much higher than the Cai- lleux's indices.
Figura 4. - Diagrama de Zingg modificado para las mismas muestras de las figuras anteriores, dibujado para una probabilidad de 0,l de la hipótesis de equivalencia. Se conservan algunas de las agrupaciones, pero se ob- serva una forma especial para la muestra 48. La muestra periglacial (44) es netamente discoidal, mientras que las fluvioglaciales tienden a dar formas en hoja de cuchillo, y las glaciales son más esferoidales. La clasificación de Zingg, indicada mediante 10s ejes de coordenadas, parece ser demasiado convencional para las formas de es- tas muestras. Nótese también que la dispersión de 10s indices de Zingg es muy superior a la de 10s de Cailleux.
gram is proposed in the second option by repre- sentation of the Cailleux's flatness index against the Kuenen's roundness index, both on logarith- mic scales. The diagrams include numbered points which represented the codified mean va- lues of the samples, and rectangles which re- present the half distances between means cor- responding to a value of the nul1 hypothesis selected from 0.1, 0.05, 0.02 and 0.01 (see intro- duction and figs. 3 and 4). The program com- putes the distance between samples for every index and compares it with the critical distance corresponding to the preselected probability; the critical distances most similar to the actual ones are selected and used to drawn the rec- tangles. It is in fact a comparison between pairs of samples, and consequently, the diagram may contain slight errors, which can be identified by inspection of the half matrices of the equiva- lence probabilities and corrected by modifying the order of request of the samples to be com- pared. The rectangles can be highly assymme- trical if the standard deviations of the close samples are much different; a modification of the order of the request can also reduce such asymmetries. In spite of these difficulties, the diagrams are very useful for simultaneous com- parison of groups of samples, and usually some clusters are immediately apparent. The threshold probability to be used can be selected after inspection of the matrices, but usually 0.1 is enough for the first trial; if sepa- ration of the samples or groups of them is evi- dent, the probability can be reduced for a more accurate analysis. The coordinate centre of the drawing is automatically selected by the pro- gram to avojd disappearance of any sample; the program also warns if the samples are too dif- ferent to be shown in the same diagram.
ACKNOWLEDGEMENTS
Thanks are due to J. Bru and M. Vilaseca for the use of their ~mpublisheddata, and to Dr. N. Cox for the manuscript revision and his comments.
REFERENCES
CAILLEUX, A. et TRICART, J., 1959: Initiation h l'étu- de des sables et galets. C.D.U. Paris, Tom. I, I et 111. GALLART, F., 1981: Morphométrie des galets: quel- ques perfectionnements a la méthode &A. Cailleux. Revue de Géomorphologie Dynamique 30 (3): 95-111. KUENEN, Ph. H., 1956: Experimental abrasion of peb- bles, 2 rolling by current. Journal of Geology 64: 336-368. PRINCE, E., 1982: Mathematical techniques in Crys- tallogvaphy lznd Materials Science. Springer-Verlag, New York, 192. TRICART, J. et CAILLEUX, A., 1962: Traité de Géo- morphologie: Tome 111, Le modelé glaciaire et ni- val. SEDES, Paris, 508 p. ZINGG, Th., 1935: Beitrag zur Schotteranalyse, Schweiz. Mineralog. und Petrolog. Mitt. 15: 39-140.
Received, June 1985.