CS 188 Midterm Exam, 2-330 pm, Mon Oct 19, 1998
1. (a) If you consider the flow field, then the FOE is the point where all the lines con-
taining flow vectors intersect. This is the point that appears stationary.
To get the time to collision, recall that if you consider the frame of reference in
the image plane that has been shifted so that the FOE is at the origin, then the
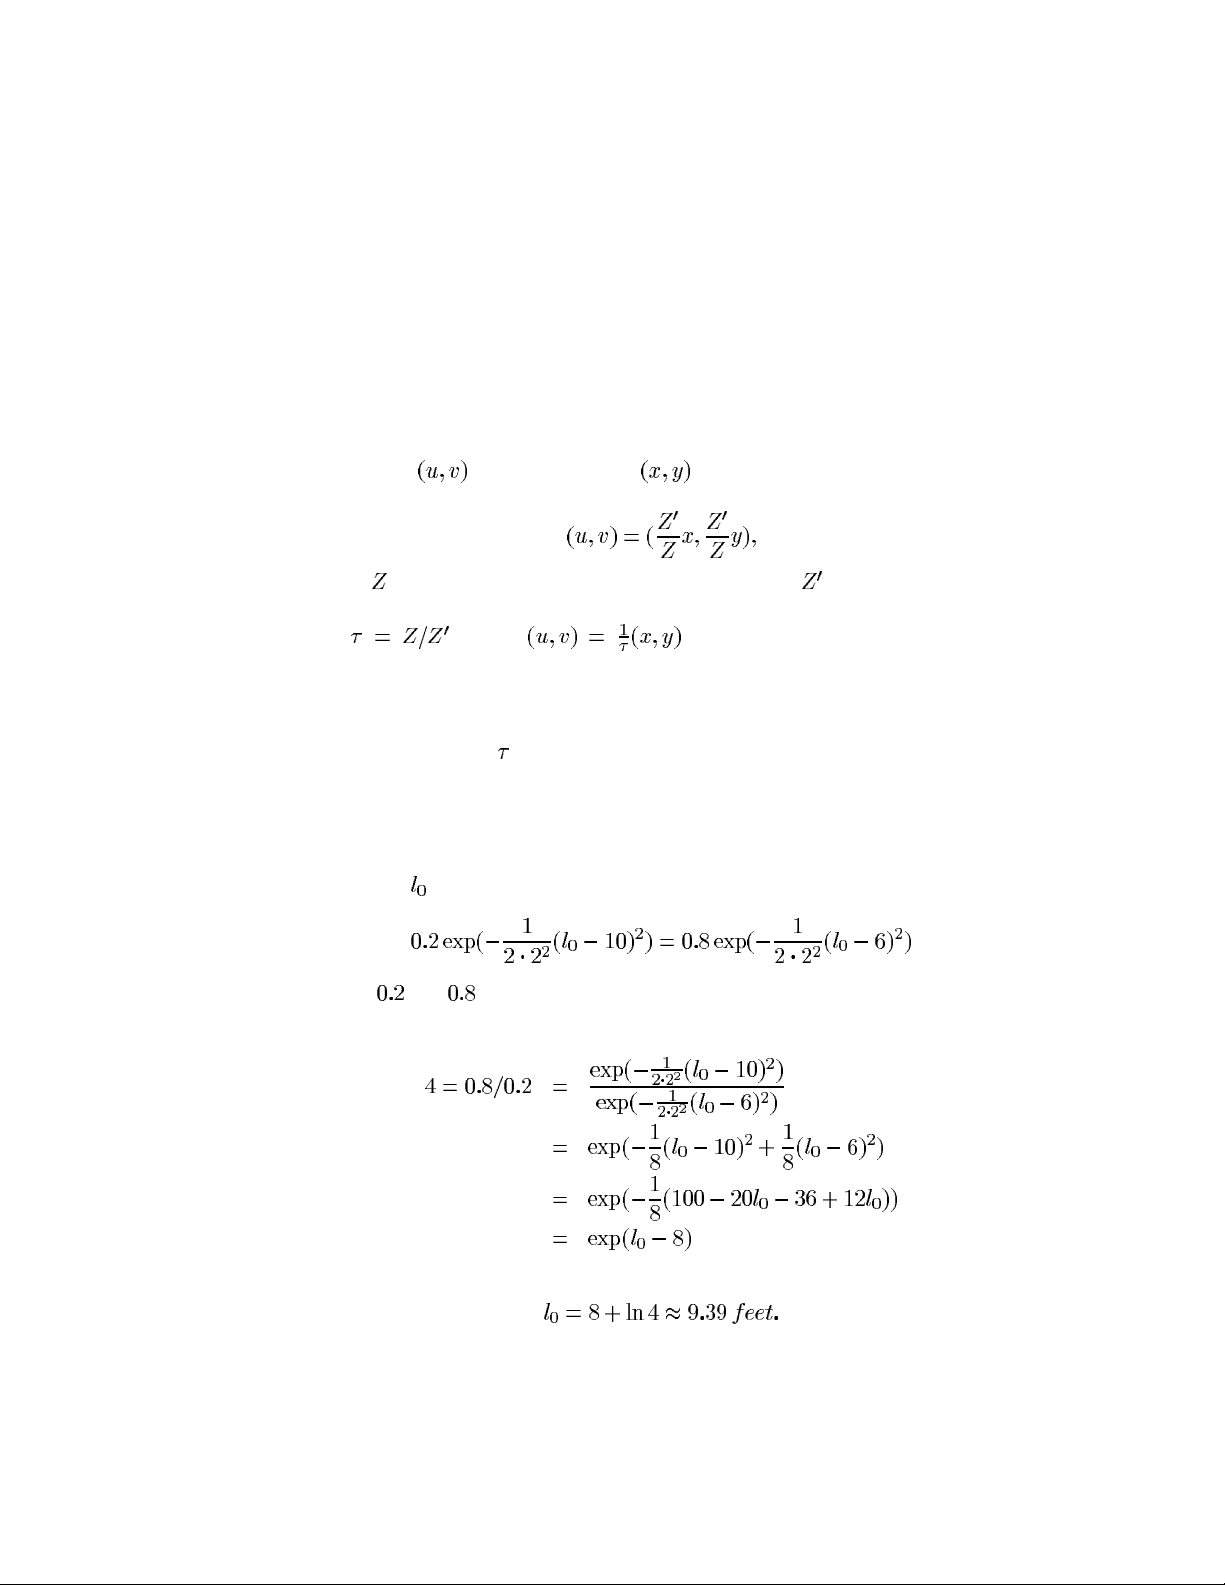
flow vector at the image point (with coordinates measured relative
to FOE) is given by
where is the distance from the target to the camera, is the normal-to-the-
image-plane component of the camera’s velocity with respect to the target. Notice
that , and so . Hence the Time-to-collision can be
found as the ratio of an image point’s distance to the FOE to the point’s apparent
speed.
(b) To go towards a target, make sure the target appears stationary (i.e., is at the FOE).
The time to collision shouldtell you when to break.
(c) Only if there is an object you know to be100 feet away, so you can steer towards
it. Optical flow (or monocular images in general) does not allow you to measure
absolute distances.
2. (a) The length should satisfy the condition:
(where and are the prior probabilities for each vehicle type).
With a few algebraic manipulations, you get:
from which you get
1